
Now that semester 1 teaching has finished and we are moving towards the assessment period, we wanted to write a blogpost to highlight the analytical reports that are available in Blackboard.
These reports can be used to monitor Blackboard usage and engagement and help you to re-enforce messages to students.
Progress Summary
By default, the student progress summary is enabled on all content items in Blackboard courses.
This allows Blackboard to record when content has been opened, and students are able to mark tasks as complete.
To access the report, click on the … to the right of the content item and select Student Progress:
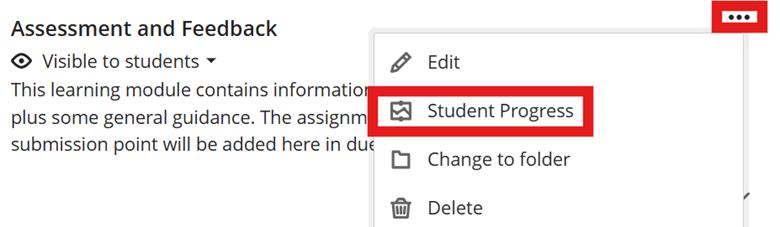
There you’ll see the progress report:

From this page, you can also filter students by those who have unopened the content, those who have started it, and those who have marked it as complete.
If you apply a filter, you can message the highlighted students using the message button.
Test question analysis
Using Blackboard tests? You can run a report to analyse the questions with:
- Average score
- Possible questions
- Completed attempts
- Average time spent on the course
In addition to this, it also allows you to re-examine questions with the Discrimination report. This indicates how well questions differentiate between students across all levels.
The difficulty report indicates which questions are easy, medium and hard.
To view the report (once the test has ended), navigate to the test and select Question Analysis:

The report will run and you will receive an email once it has completed:

Discussion analysis
Making use of Discussions in your Blackboard course? Then you can run a report for the overview which will give you the total number of active students, the average number of posts per students, as well as the average wordcount for blogposts.
You can click on Student Activity for the overview:
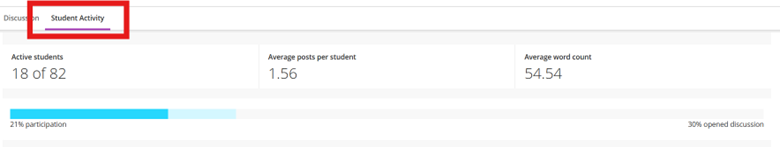
You can use the message feature to contact students who haven’t engaged, as well as see the top participants, and the responses with the most replies.
Course Analytics
The Course Analytics page allows you to flag alert settings for students based on the amount of time spent in the course and the dates since their last access.
Choose Analytics from the top menu:

You have two views:
- Student hours in the course against their overall mark

- Student list view showing overall mark against missed due dates, hours in course, and days since last access
For further information on using the Analytics feature, see Blackboard Help: https://help.blackboard.com/Learn/Instructor/Ultra/Performance/Course_Reports/Course_Activity_Related_to_Grades
If you are interested in looking in more detail at course analytics, we are holding an online training session on Monday 9 February between 15:10-16:00. You can book your place online via the training booking page.